Hamming distance is a simple distance function to impose a metrical structure over discrete non-numerical data. Hamming distance has been widely used to cluster or visualize discrete data. In VisuMap Hamming distance has been so fare the only distance function for discrete date. In this note I'll introduce the weighted Hamming distance (WHD) as an extension to the Hamming distance. After a brief review of the original Hamming distance, I'll describe WHD and demonstrate its strength with two sample datasets.
Let's first consider the one-dimensional case. Let Ω be a set of data points potentially with duplicates. Ω may represent, for instance, the hair color or blood type of a group of patients. The Hamming distance between two data points x and y is simply defined as:

The weighted Hamming distance (WHD) is defined as:

We notice that d(,) takes the value 0 and 1, whereas w(,) can take any value from 1 to |Ω|. d(,) only captures the information about equality, whereas w(,) captures, in addition to the equality, also the frequency of each different discrete value. In particular w(x,y) yields smaller distance if the value x is infrequent in Ω. In terms of our example with patients as data points, w(,) will ascribe larger closeness (i.e. smaller distance) to a pair of patients if they share a rare property values, say a rare blood type. This property of WHD make it to focus more on rare property values.
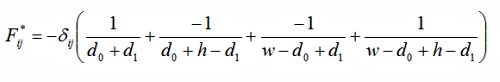
In multidimensional case, our data points will be assumed to be from a multidimensional space x = (x1, x2...xn)∈Ω1×Ω2×...×Ωn; Let y = (y1, y2...yn) be a second the data point; and let wk be the weighted hamming distance between xk and yk; then we define the multidimensional WHD between x and y as:
 We notice that the multidimensional WHD is, up to a constant factor, the harmonic mean of weighted hamming distance of each individual dimension. The harmonic mean, like the normal arithmetical mean, yields a number between the minimal and maximal value in {w1, w2, ..., w3}, except that the harmonic mean is normally shifted towards the minimal value. The use of harmonic mean instead of the squared sum (as used by Euclidean distance) makes w(,) bias towards smaller values in the set {w1, w2, ..., wn}. This means, in terms of our example with patient data, we ascribe more importance to those properties which show larger proximity between data points. For instance, if the hair color property are more or less randomly distributed among the patients, but some specially blood types occur only rarely, then the blood type property will be more importance with respect to the harmonic mean.
To see the difference between WHD and normal hamming distance we first consider the sample dataset Adult Database in the UCI Machine-Learning repository that collects information about students. For the sake of simplicity I just use two properties, education and race, to generate MDS maps. The following are the MDS maps generated with CCA mapping algorithm with WHD and normal hamming distance, on the left and right side respectively:

In above picture we can see clearly in the left map that three large clusters occupy the whole data space, whereas the left map only show a cloud with discrete data points without visual information about the cluster sizes.
As second example we consider a dataset in Haplotype Analysis. This dataset contains about 2000 data points each comprises the haplotypes of about 160 SNPs. The following picture shows the MDS maps generated with the tSNE algorithm with WHD and normal Hamming distance, on the left and right side respectively:

We notice that map on the left side reveals about 8 clusters with different sizes, whereas the map on the right side (generated with Hamming distance) shows four, more or less, symmetrical clusters. The map generated with WHD shows more structure and complexity, but is up to the scientist to verify the relevance of those extra structural information.
Weighted hamming distance has been implemented in VisuMap 4.0 as a new metric for enumerated data. The above sample maps are generated with VisuMap version 4.0.891.
Let's first consider the one-dimensional case. Let Ω be a set of data points potentially with duplicates. Ω may represent, for instance, the hair color or blood type of a group of patients. The Hamming distance between two data points x and y is simply defined as:
where p(x) is the frequency of the value x in Ω. |Ω| is the number of data points in Ω. w(x,y) is an extension of d(x,y) in the sense that d(x, y) < d(x', y') always leads to w(x, y) < w(x',y'). On the other side, w(,) is actually not a distance function in strict terms of mathematics, since w(,) does not fulfill the requirement w(x,x) ≡ 0.
We notice that d(,) takes the value 0 and 1, whereas w(,) can take any value from 1 to |Ω|. d(,) only captures the information about equality, whereas w(,) captures, in addition to the equality, also the frequency of each different discrete value. In particular w(x,y) yields smaller distance if the value x is infrequent in Ω. In terms of our example with patients as data points, w(,) will ascribe larger closeness (i.e. smaller distance) to a pair of patients if they share a rare property values, say a rare blood type. This property of WHD make it to focus more on rare property values.
In multidimensional case, our data points will be assumed to be from a multidimensional space x = (x1, x2...xn)∈Ω1×Ω2×...×Ωn; Let y = (y1, y2...yn) be a second the data point; and let wk be the weighted hamming distance between xk and yk; then we define the multidimensional WHD between x and y as:
To see the difference between WHD and normal hamming distance we first consider the sample dataset Adult Database in the UCI Machine-Learning repository that collects information about students. For the sake of simplicity I just use two properties, education and race, to generate MDS maps. The following are the MDS maps generated with CCA mapping algorithm with WHD and normal hamming distance, on the left and right side respectively:

In above picture we can see clearly in the left map that three large clusters occupy the whole data space, whereas the left map only show a cloud with discrete data points without visual information about the cluster sizes.
As second example we consider a dataset in Haplotype Analysis. This dataset contains about 2000 data points each comprises the haplotypes of about 160 SNPs. The following picture shows the MDS maps generated with the tSNE algorithm with WHD and normal Hamming distance, on the left and right side respectively:

We notice that map on the left side reveals about 8 clusters with different sizes, whereas the map on the right side (generated with Hamming distance) shows four, more or less, symmetrical clusters. The map generated with WHD shows more structure and complexity, but is up to the scientist to verify the relevance of those extra structural information.
Weighted hamming distance has been implemented in VisuMap 4.0 as a new metric for enumerated data. The above sample maps are generated with VisuMap version 4.0.891.