Friday, May 13, 2011

VisuMap v3.5 Relased.

Today we have released VisuMap version 3.5.864. This version is a major upgrade from its previous version 3.2; it is marked by the following major changes:
  • Multi-core optimization: we have implemented extensive optimization for most algorithms to exploit multi-core computer system. By default, VisuMap 3.5 will automatically make use of all available CPU cores with multi-threading technology. The user can also explicitly limit the number of processing unit through the application configuration property WorkThreads. On our 6-core Windows 7 test machine we have often achieved 3-5 times performance speedup.

  • Updated DirectX Library: VisuMap used DirectX+MDX (managed directX) to implement hardware accelerated visualization service. Since MDX has been discontinued as a component in new generations of .NET platform, we have to switch to another product. In VisuMap v3.5 we have replaced MDX by SlimDX that is an open source library with similar goal as MDX. With this change, we not only significantly improved the rendering performance, but also reduced the dependency on old obsoleted software components. VisuMap can now be installed on most Windows 7 machines without pre-installing any other software. Some older systems may need to upgrade to the latest DirectX runtime library through the normal DirectX web installer.
  • Many bug fixes and enhancements: Based on customer feedback VisuMap has undergone many small changes. Most of them have already made available through previous minor releases. Worth mentioning is here the extension of the XY plot that made this simple service a generic tool for large datasets; as well as addition of new glyphsets and utility scripts. We have recently also released some VisuMap plugins which extend VisuMap for special user groups. For instance, the plugin for Multivariate Analysis and Wave Transformations. Also, the Customer Importer plugin has been extended to import FCS (Flow Cytometry Standard) files.

VisuMap v3.5 is backwards compatible with its previous versions. All existing datasets will silently upgraded to the new version when loaded into VisuMap. Existing users can upgrade to the new version, as long as the license type allows it, by simply clicking on the menu Help>Check for Updates in VisuMap's main window.


Wednesday, April 6, 2011

Self-similarity of high dimensional random walk process

A high dimensional random walk process (RWP) is the trajectory of a vector variable whose components change independently and randomly step by step, in discrete time space, for a small constant percentage. High dimensional RWP can be used as the starting point to investigate changing complex systems. For instance, as discussed in this blog, the stocks price history of 500 stocks can be considered as a 500 dimensional RWP.

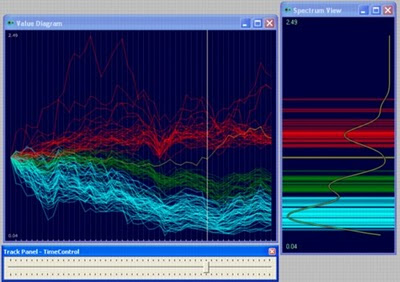
Self-similarity means that an object is, from certain point of view, similar to parts of itself. A high dimensional RWP is self-similar in the sense that each sub-section of it follow the same statistical constraints. Thus, the randomness is a property shared by RWP and its sub-sections. We can generate series of 1000 data points of a 500-dimensional RWP with the following VisuMap's JavaScript code:

var n = 1000;
var dim = 500;
var rwp = New.NumberTable(n, dim);
var m = rwp.Matrix;
for( var col=0; col < dim; col++) {
m[0][col] = 1.0;
for(var t=1; t < n; t++) {
m[t][col] = m[t-1][col] * (1 + 0.01*(Math.random() - 0.5) );
}
}
rwp.ShowValueDiagram();

How can we visualize the self-similar randomness in high dimensional RWP? A simple way is to use a dimensionality reduction method to map the high dimensional trajectory to low dimensional space, then plot it out on paper or screen. The following picture for instance shows two CCA (curvilinear component analysis) maps of the 1000 data points mapped to the 3 dimensional space:

We can see the randomness of the trajectory in above picture, but the self-similarity is hardly apparent. This is because, as intrinsically to the human perception, we normally only good at recognizing similarity between geometric patterns, but not similarity between random patterns.

Fortunately, when we use principal component analysis (PCA) to project the trajectory to low dimensional space, we get much easier recognizable patterns. For instance, the following picture shows the projections of our sample RWP to some major principal components (ie. eigenvectors):


The PCA projection to the major principal components apparently filtered out the randomness of the data, like a low pass filter suppresses high frequency noises. Now, we can select three principal components, say the second, third and forth components as our projection axes; then plot the PCA projection of the data (or sub-sections of it) to these three axes. As be illustrated in the following picture, we can see that they are all geometrically similar to each other albeit with different densities.


Notice that in above picture, the projection axes are the second, third and forth principal components of the selected data, not those of the complete dataset. The following video clip shows what we have discussed above in a more intuitively way:


One practical use of studying RWP is to find non-randomness ( that is information ) in seemly random data. Using the PCA technique we can show random data as easy recognizable patterns which enable us to detect deviations from those patterns, so that we can quickly find potential information in apparently random data.

Friday, April 1, 2011

Pirated software web sites

I have notice that more than a dozens so-called freeware web sites now provide pirated version of VisuMap software. All those sites seem to be originated from a single source, as they are all organized in a similar way and all pirated the version 3.2.854 of VisuMap. I have spent 2 or 3 hours to investigate those sites, the followings are what I have found:


  • These sites have done a pretty good SEO (search engine optimization) job, they pretty much over flooded search results when I searched for "VisuMap download" on Google. Google is clearly loosing the battle against those mis-information.

  • Most of these sites are not really free. They usually re-direct users through a chain of redirections with dubious ads (they hold the user with popups for popups, you need to shutdown the browser to get away from them), then at the end they usually require users to sign up for paid service for "fast" download.

  • All product information about VisuMap on those sites are copy and pasted from VisuMap's web site. Some sites used translation engine to translate English to other languages with horrible results.

  • All information about downloading sites, speed, etc. on those site are faked and likely automatically generated to fool users and search engines.

  • I have tested the pirated software on an isolated machine. I scanned the software with anti-virus software, no virus or spyware has been detected.

  • The pirated software seemed to run smoothly on the test machine, although it felt a little sluggish. Since it has no proper license, it won't be able to get online update from VisuMap's web site.

  • The pirated software has an obsoleted version, so that it won't be able to use some new plugin extensions for VisuMap.

With so many limitations and apparent dubious practice, I don't think those pirate sites will have serious impact on the legitimated software vendors. But, they clearly post a challenge for Internet searching engines.


Thursday, November 4, 2010

Visualizing dynamics in time series data.

We have just released a short video clip that shows how VisuMap visualizes dynamics in time series data. This demo uses a feature of the spectrum view that smoothly changes the display from one configuration to another one. This video is inspired by the some samples from google data explorer. It is amazing how human eyes can quickly capture such characteristics like speed and variations if the data is properly visualized.

This video uses some features in VisuMap available in VisuMap version 3.2.855. The sample datasets used in the video are included in the standard installation of VisuMap.