Given two sets of attributes, X = (x1, x2, ..., xp) and Y = (y1, y2, ..., yq), how do we quantify the dependency between X and Y?
If both X and Y are one dimensional numerical attributes, we can use linear correlation coefficient to quantify the dependency between X and Y. For multidimensional X and Y (that is our data are numerical matrices of dimension n×p and n×q respectively, assuming that we have sampled n data points) we can use canonical correlation analysis (CCA) to capture the dependency between X and Y. Linear methods are in general effective and simple to use. VisuMap offers support for CCA and many other linear analysis services through a plugin module MultivariateAnalysis. However, linear methods work only for numerical attributes and can only capture linear relationships.
In this note I'll describe a more general method to quantify dependency between attributes. The method can be applied to non-numerical data and can capture non-linear relationships. The method is based on the concept conditional entropy from information theory. Assuming that X and Y are two random variables, the information gain ratio from X to Y is defined as following:

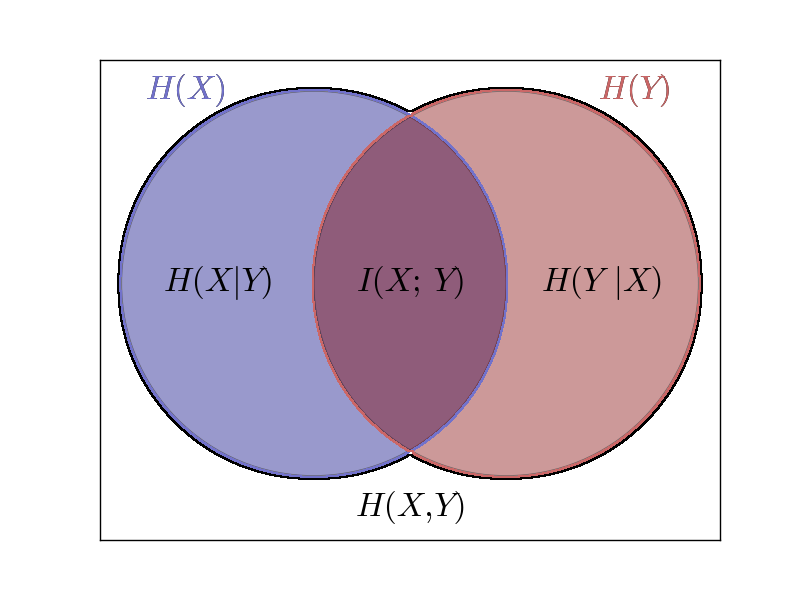
where H(Y) is the entropy of Y, and H(Y|X) is the conditional entropy of Y under the conditional that X is known. The numerator H(Y) - H(Y|X) is also called the mutual information between X and Y, and it is normally denoted as I(X; Y). So, the above formula can also be defined as R(X;Y):=I(X;Y)/H(Y). The following diagram shows the relationship between various types of entropy relating to two random variables:
In general, R(X; Y) tells us how much information we gain about Y when the value of X becomes known. R(X; Y) is a number between 0 and 1.0. If R(X;Y)=0, then X and Y are independent from each other, knowing X does not provide any information about Y. If R(X;Y)=1.0, then Y is completely dependent on X, i.e. Y is completely determined by the value of X.
Now, let's go back to our original problem. We assume that X and Y are now two tables of dimension n×p and n×q respectively, and X and Y may contain numerical and non-numerical values. In order to calculate the information gain ratio between X and Y we first convert them to random variables. To do so, we pick two clustering algorithms C and D that can be applied on X and Y. The clustering algorithm will assign each of the n data point to a label of label sets X and Y respectively:
C: N → X
D: N → Y
where N:= {1,2,3, ..., n} is the set of data sample indexes. We then define two random variables X' and Y' over X and Y as following:

With above definitions we can then apply the formula for R(X;Y) to the random variables X' and Y'. In particular, we have the following detailed formula to calculate the generalized information gain ratio (GIGR) of X for Y:

We notice that GIGR in above formula is indexed by the two clustering algorithms C and D. This means that the calculation is dependent on what clustering algorithms we choose for X and Y. In other words, the method described here is actually a meta-algorithm that requires, apart from two input data tables, also two clustering algorithms as input.
The clustering algorithms C and D plays an essential role in GIGR. They determine the granularity of the entropy calculation. More particularly, RC,D will be maximum if C and D are the finest clustering algorithms by creating unique label for each distinguished data point. On the other side, RC,D will be zero, if C and D, as the coarsest clustering algorithm, simply assign all data points to single label.
We can also consider the clustering algorithm in GIGR as a quantization method that converts data from multidimensional discrete or continues domain to one-dimensional discrete domain, so that we can effectively apply the information theoretical calculation on them.
In practise, C and D can be different clustering algorithms. The main requirement on C and D is that they can be applied on data tables X and Y separately and can assign a label to each data row. In fact, the data X and Y don't even have to be tables. They can be, for instance, a tree structures or DNA sequences. To apply our method, we just need to pick appropriate clustering algorithms for the data types.
It should be pointed out here that GIGR described here does not bias towards any type of clustering algorithms. In fact, I believe that any clustering algorithm would be appropriate for certain type of problems. The attached script code implemented 6 different groups of clustering algorithms to calculate GIGR with VisuMap.
Since the two clustering algorithms in GIGR are kind of input, we can use GIGR to investigate similarity between different clustering algorithms. For instance, if RC,D(X; X) is close 1.0 for a data set X, then the two clustering algorithms C and D produce similar results with respect to our data. Thus, in the practise, we might use the algorithm that is easier to implement, if the GIGR indicates that two algorithm produce similar results.
Also along the same line, GIGR can be used as an indicator for the stability of clustering algorithms. Many clustering algorithms, like the k-mean algorithm, are non-deterministic in the sense that repeating the algorithm on the same data normally yields different result. We would normally favor an algorithm that maintain certain level of stability so that the clustering results remain more or less the same. When we calculate RC,C(X; X) by repeating algorithm C twice on X, we would normally get a GIGR value that is smaller than 1.0 for non-deterministic clustering algorithms. In these cases, there closer RC,C(X; X) is to the value 1.0, the more stable is C with respect to the data set X.
Appendix:
The following JavaScript code helps users to calculate the GIGR with VisuMap software application:

