Genomes of multi-cellular organism often contain short sequences with many duplicates which have been created and preserved with minor mutations during their evolutionary processes. Those nucleotide sequences, called here generically motifs, carry important information about the structure and history of those genomes. Better understanding of those motifs could help us to explore the function and evolutionary path of genetic code.
In this note I'll put forward a method to visualize motifs as 3D dotted maps, where each motif is represented by a dot in the 3D space; and sub-groups of motifs may take different shapes, which I'll try to interpret in terms of evolutionary variations.
I have put forward some methods to visualize DNA sequence a while ago. In those early attempts, different scanning machines were used to extract high dimensional vectors from DNA sequences; which are then mapped into 3D space with multidimensional scaling algorithm. A main problem of those methods is that they are often not very sensitive towards sequential variations, so that the resulting maps lack capability to reveal structural information. The method presented here basically follows the same framework, except that we'll not use scanning machine, but feed the motif sequences as data points directly into the multidimensional scaling algorithm which uses the neadleman-wunsch algorithm to calculate the editing distance between the motifs.
In the following I'll use the chromosome I of Caenorhabditis Elegans as an example to detail the steps of the visualization process.
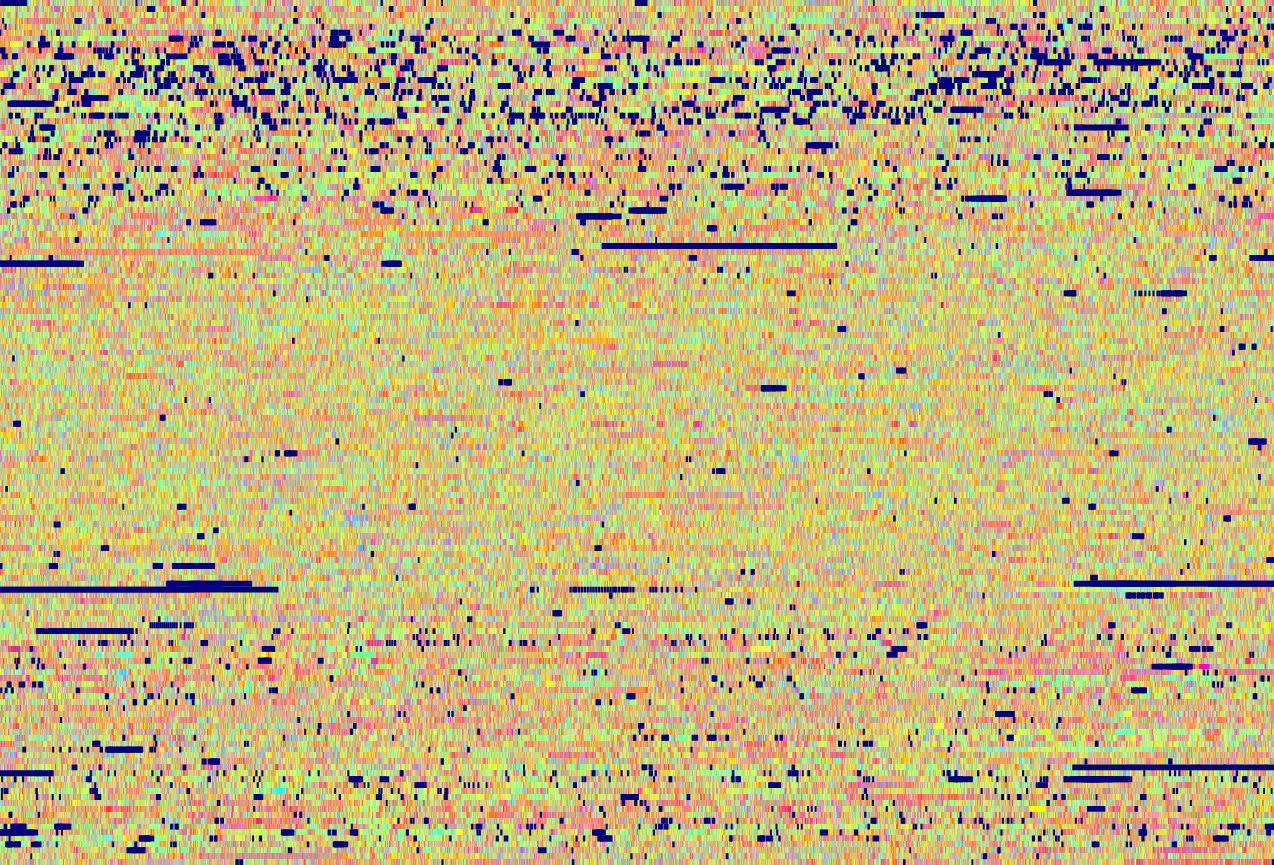
Firstly, I downloaded the sequence of chromosome I of C. Elegans from the NCBI site (NC_003279) I then created an blast database for the chromosome with the makeblastdb program; then I used the blastn program to query on all sub-sequences of length 30 nucleotide bases; A sub-sequences will be recorded as motif, if it has more than 30 duplicates on either strand of the chromosome, where a fuzzy matching with one or two mutation or deletion/insertion are employed. In this way 4578 motifs have been found among the chromosome I that has length of about 15 million nucleotide bases. The following picture shows the distribution of these motifs on the chromosome:

In above picture nucleoside types A, C, G, T are shown by color yellow, magenta, red and cyan respectively; The locations of motifs are marked by blue bars. We notice that many motifs overlap each other. Those overlapping motifs are merged together to form the 4578 disjunctive sequences of different length as be shown in following table:

I then apply the t-SNE algorithm on these 4578 motifs to create a 3D map. I used needleman-wunsch algorithm to calculate the minimal editing distance between the motif sequences. The needleman-wunsch algorithm uses a simple penalty schema of (2, 0, 1) for gape, match and mismatch respectively. The following picture shows the resulting 3D dotted map:

Then a clustering algorithm (a combination of k-mean algorithm and mean-shifting algorithm) is applied to the 3D map that results in coloring of major clusters with different colors. With some minor manual color adjustment, we obtained a colored 3D dotted map as shown in the following animation:
From the above map we can roughly find clusters of the following shapes:
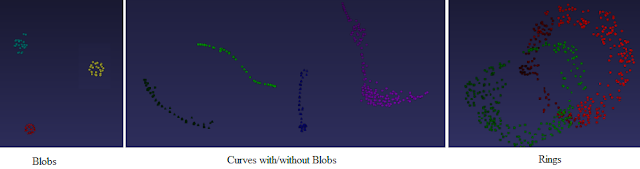
Assuming that all motifs are created by duplication and random single nucleotide mutations, we could interpret above shapes as following: Motifs form shape of small blobs indicate those motifs originated from a common ancestor and have undergo minor mutations. Those motifs could be either recent duplicates, so that they don't have time to accumulate large number of mutations. Or, if they exist for long time, their mutation with large number of mutation did not survive the evolutionary selection process.
Motifs form the shape of curves indicate that those motifs, originating from a common ancestor, have mutated gradually away from its initial copy. With help of VisuMap software we can locate those motifs in the chromosome and trace their evolutionary process along the curve ( but we cannot say which end of the curve is the starting end.) The following pictures show a case with a curved motif collection:
 In above pictures, the top picture shows a section of the 3D motif map; the second picture shows corresponding locations of those motifs on the chromosome. With VisuMap you can interactively move the selection of motifs in the window displaying the first picture, so that the second picture will mark the location of selected motifs. The last picture shows the nucleotide sequences of these motifs, one motif per row, in the order along the curve from left to right. We can see that these motifs gradually shifted their phases.
We notice some curved motif groups have small blobs attached to them. These blobs might indicate short bust of different mutations.
Interestingly, we see two motif clusters in the 3D map which form roughly two parallel rings. Those motifs are distributed across the whole chromosome, they may have some internal relationship, but I'm not sure in moment how to interpret them in terms evolutionary process.
In addition to C. Elegans, I also applied the visualization algorithm to other organisms. The following short video clips shows several motif maps of the rice and human genome:
It should be noted that for the human chromosomes, calculating the motif map with the current implementation for all motifs would be computationally prohibitive. So, I used a simplified version of blastn; and selected three small sub-sets, each with about 20 000 motifs, for above motif maps. The three sub-sets have increasing duplicate frequencies. So, for instance, motifs of the third set all have over 10 000 duplicates; whereas the first set has motifs with 300 to 500 duplicates.
From above maps we can see that the motifs of rice genome are much less structured: almost all of them are just small blobs. Those motifs are, unlike the case with C. Elegans, mostly located in coding area. On the other side, the motif map of the human genome shows diverse structures depending on the duplicate frequencies; and the third motif map evens shows some kind of 2-dimensional structure.
Discussion
The visualization method presented here provides a simple way to extract geometrical models from pure discrete genetic sequence information. These geometrical shape provide intuitive information about the evolutionary path of genetic code; and they might be helpful to profile and explore whole genome structures.
The method presented here has three key components: the way to find motifs; the way to calculate editing distance and the multidimensional scaling algorithm (MDS). Each of these three methods has significant impact on the results and they also pose significant limitations. For instance, the current implementation of these components are quite slow, so that it is difficult to visualize large motif sets. I have experimented with other editing distance, like the smith-waterman and levensthein method, they seem to perform similarly, needleman-wunsch just produces slightly better visualization. For the future investigation we might work on finding more efficient MDS algorithm or finding more efficient distance metric to help us to attack much larger and different groups of genetic code.
In this note I'll put forward a method to visualize motifs as 3D dotted maps, where each motif is represented by a dot in the 3D space; and sub-groups of motifs may take different shapes, which I'll try to interpret in terms of evolutionary variations.
I have put forward some methods to visualize DNA sequence a while ago. In those early attempts, different scanning machines were used to extract high dimensional vectors from DNA sequences; which are then mapped into 3D space with multidimensional scaling algorithm. A main problem of those methods is that they are often not very sensitive towards sequential variations, so that the resulting maps lack capability to reveal structural information. The method presented here basically follows the same framework, except that we'll not use scanning machine, but feed the motif sequences as data points directly into the multidimensional scaling algorithm which uses the neadleman-wunsch algorithm to calculate the editing distance between the motifs.
In the following I'll use the chromosome I of Caenorhabditis Elegans as an example to detail the steps of the visualization process.
Firstly, I downloaded the sequence of chromosome I of C. Elegans from the NCBI site (NC_003279) I then created an blast database for the chromosome with the makeblastdb program; then I used the blastn program to query on all sub-sequences of length 30 nucleotide bases; A sub-sequences will be recorded as motif, if it has more than 30 duplicates on either strand of the chromosome, where a fuzzy matching with one or two mutation or deletion/insertion are employed. In this way 4578 motifs have been found among the chromosome I that has length of about 15 million nucleotide bases. The following picture shows the distribution of these motifs on the chromosome:
In above picture nucleoside types A, C, G, T are shown by color yellow, magenta, red and cyan respectively; The locations of motifs are marked by blue bars. We notice that many motifs overlap each other. Those overlapping motifs are merged together to form the 4578 disjunctive sequences of different length as be shown in following table:

I then apply the t-SNE algorithm on these 4578 motifs to create a 3D map. I used needleman-wunsch algorithm to calculate the minimal editing distance between the motif sequences. The needleman-wunsch algorithm uses a simple penalty schema of (2, 0, 1) for gape, match and mismatch respectively. The following picture shows the resulting 3D dotted map:

Then a clustering algorithm (a combination of k-mean algorithm and mean-shifting algorithm) is applied to the 3D map that results in coloring of major clusters with different colors. With some minor manual color adjustment, we obtained a colored 3D dotted map as shown in the following animation:

Assuming that all motifs are created by duplication and random single nucleotide mutations, we could interpret above shapes as following: Motifs form shape of small blobs indicate those motifs originated from a common ancestor and have undergo minor mutations. Those motifs could be either recent duplicates, so that they don't have time to accumulate large number of mutations. Or, if they exist for long time, their mutation with large number of mutation did not survive the evolutionary selection process.
Motifs form the shape of curves indicate that those motifs, originating from a common ancestor, have mutated gradually away from its initial copy. With help of VisuMap software we can locate those motifs in the chromosome and trace their evolutionary process along the curve ( but we cannot say which end of the curve is the starting end.) The following pictures show a case with a curved motif collection:

We notice some curved motif groups have small blobs attached to them. These blobs might indicate short bust of different mutations.
Interestingly, we see two motif clusters in the 3D map which form roughly two parallel rings. Those motifs are distributed across the whole chromosome, they may have some internal relationship, but I'm not sure in moment how to interpret them in terms evolutionary process.
In addition to C. Elegans, I also applied the visualization algorithm to other organisms. The following short video clips shows several motif maps of the rice and human genome:
It should be noted that for the human chromosomes, calculating the motif map with the current implementation for all motifs would be computationally prohibitive. So, I used a simplified version of blastn; and selected three small sub-sets, each with about 20 000 motifs, for above motif maps. The three sub-sets have increasing duplicate frequencies. So, for instance, motifs of the third set all have over 10 000 duplicates; whereas the first set has motifs with 300 to 500 duplicates.
From above maps we can see that the motifs of rice genome are much less structured: almost all of them are just small blobs. Those motifs are, unlike the case with C. Elegans, mostly located in coding area. On the other side, the motif map of the human genome shows diverse structures depending on the duplicate frequencies; and the third motif map evens shows some kind of 2-dimensional structure.
Discussion
The visualization method presented here provides a simple way to extract geometrical models from pure discrete genetic sequence information. These geometrical shape provide intuitive information about the evolutionary path of genetic code; and they might be helpful to profile and explore whole genome structures.
The method presented here has three key components: the way to find motifs; the way to calculate editing distance and the multidimensional scaling algorithm (MDS). Each of these three methods has significant impact on the results and they also pose significant limitations. For instance, the current implementation of these components are quite slow, so that it is difficult to visualize large motif sets. I have experimented with other editing distance, like the smith-waterman and levensthein method, they seem to perform similarly, needleman-wunsch just produces slightly better visualization. For the future investigation we might work on finding more efficient MDS algorithm or finding more efficient distance metric to help us to attack much larger and different groups of genetic code.