We have finally released VisuMap version 2.4.754 today. In this and several previous minor releases we have made major effort to re-structure and optimize the software to accoommand extermely large datasets. The software can now directly load datasets with upto 10000 data columns and show them as tables, diagrams and maps!
Standard GUI controls of .NET library (like DataGridView) can only support table upto 1000 columns. For tables with more than 5000 columns the user interface becomes practially unusable. So we have implemented explicite paging mechanism (which we call column band) that allows user to select a subset of columns for processing.
Interestingly the DataGridView has no performance issues with large number of rows (e.g. > 20000 rows).
Another major addition to the software is the introduction of attribute mode for several views, like the details table and value diagrams. Up to now, VisuMap has mainly focused on exploration from the perspective of the object domain, so that users can easily select and explorer sub sets of bodies (or data rows). With the attribute mode, we have drastically simplified the investigation in the attributes domain (e.g. data columns). For instance, a user can select a subset of attributes by the mouse button, then create PCA projection of the selected attributes.
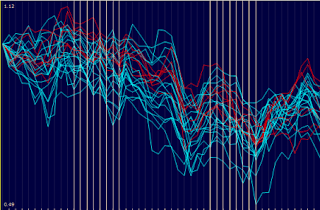
For example, the following value diagram shows the price history of some stocks. If we are interested in correlation between these stocks during the two major market down-turn periods, we can simply select these two periods and open the 3D PCA projection window for the selected attributes.
Thursday, June 21, 2007
Subscribe to:
Post Comments (Atom)

No comments:
Post a Comment